Yonder Data Solutions helps organisations capture reliable insights through online and telephone research (CATI), generating the data that supports smarter decision-making. However, collecting data is only part of the challenge. Transforming it into something people can easily explore, understand, and act on is where real value is created.
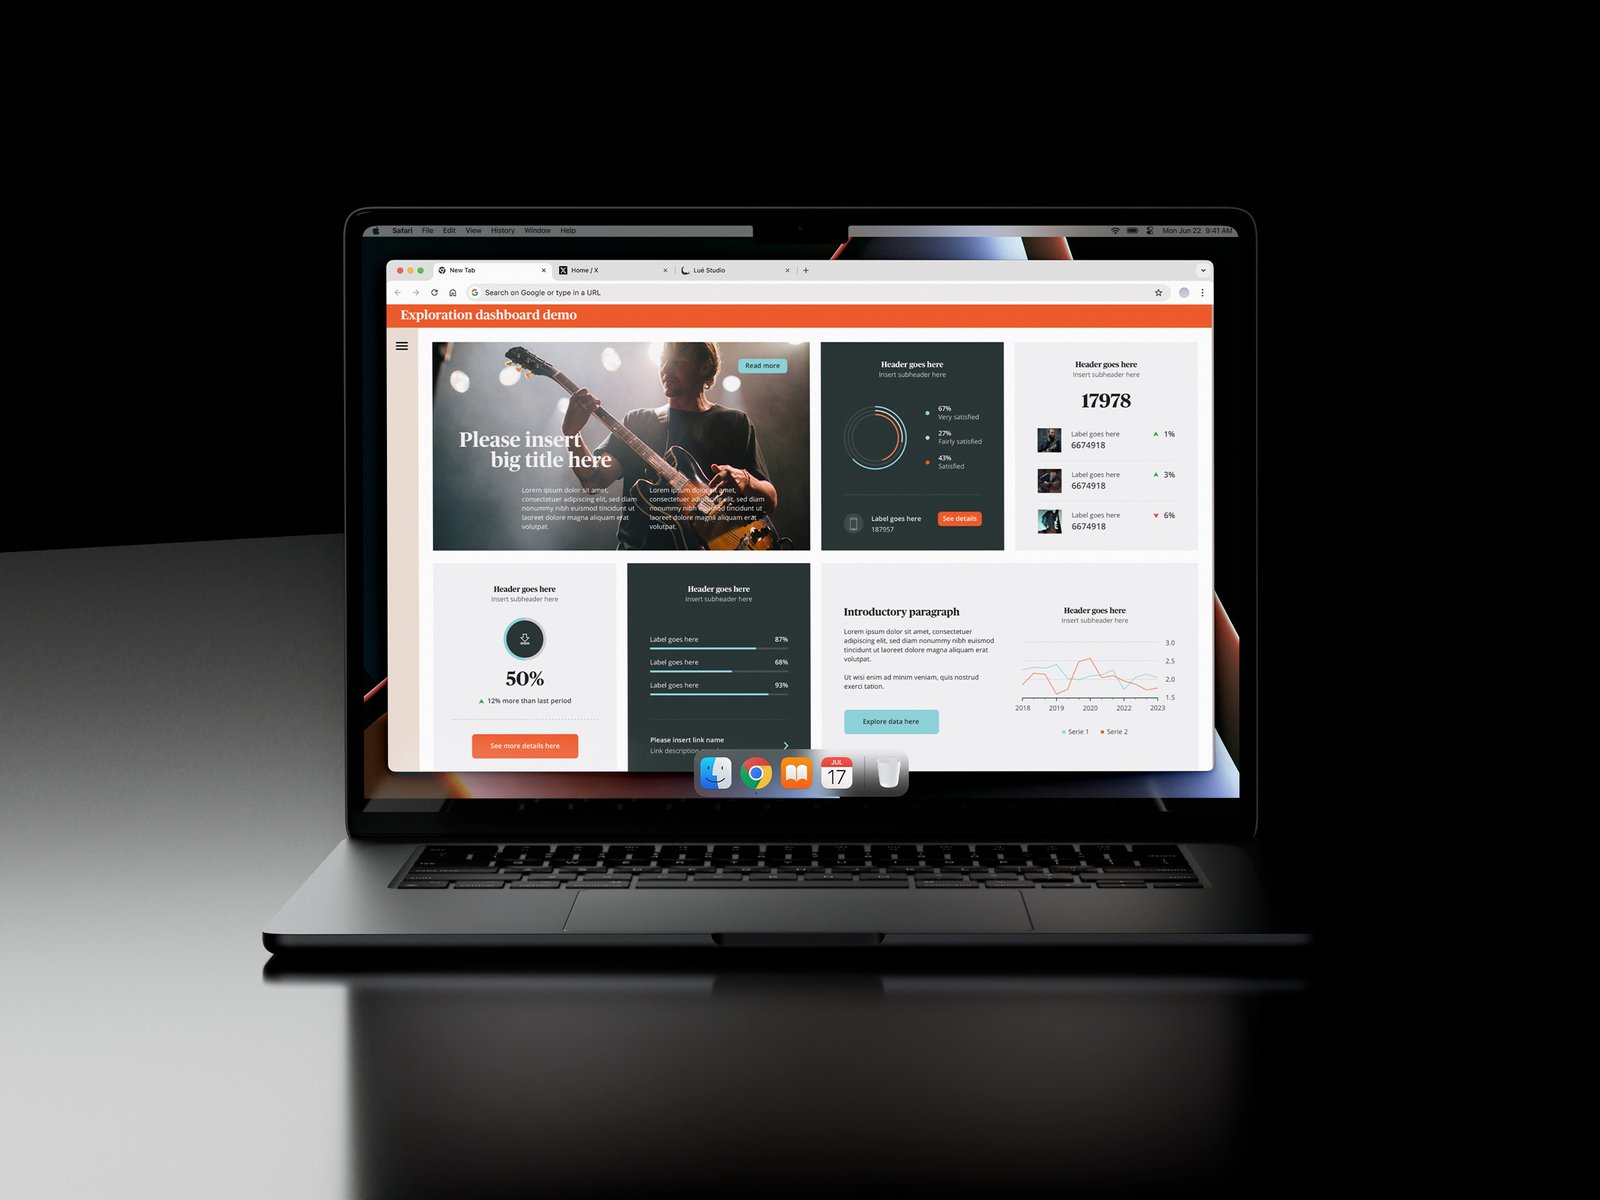
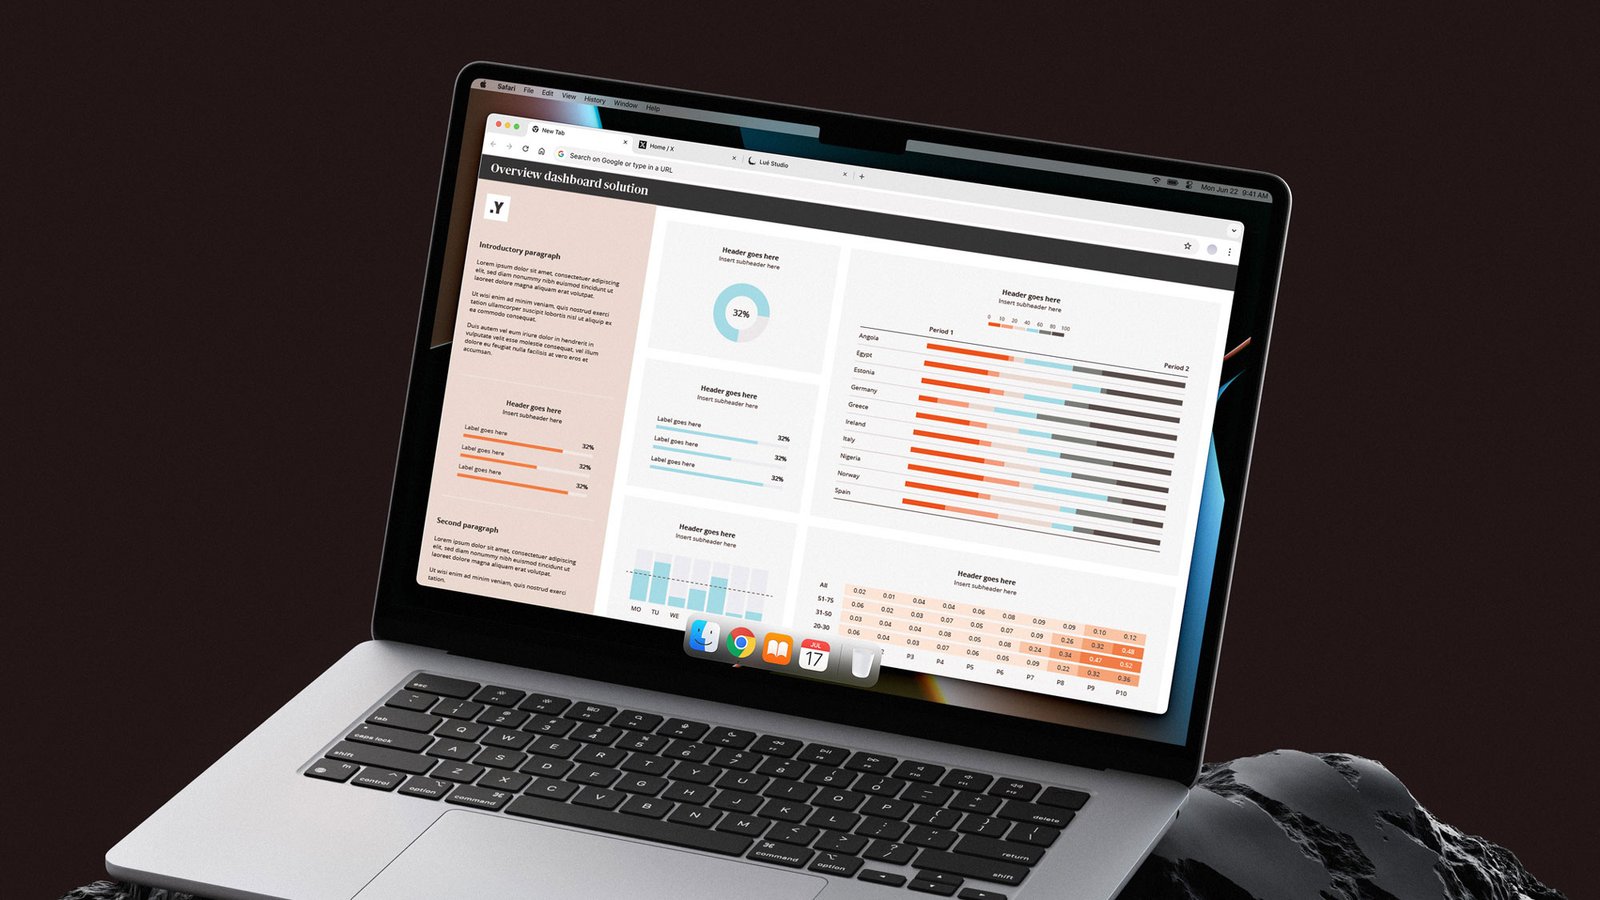
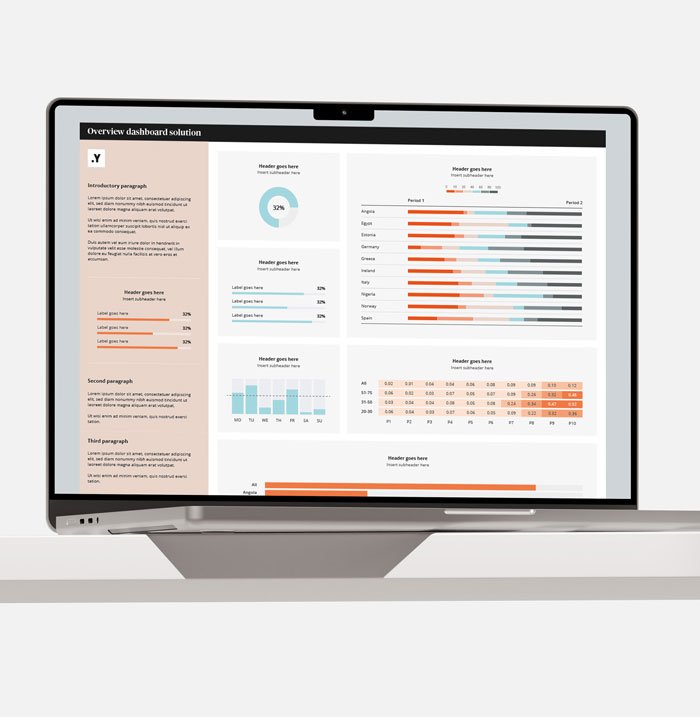
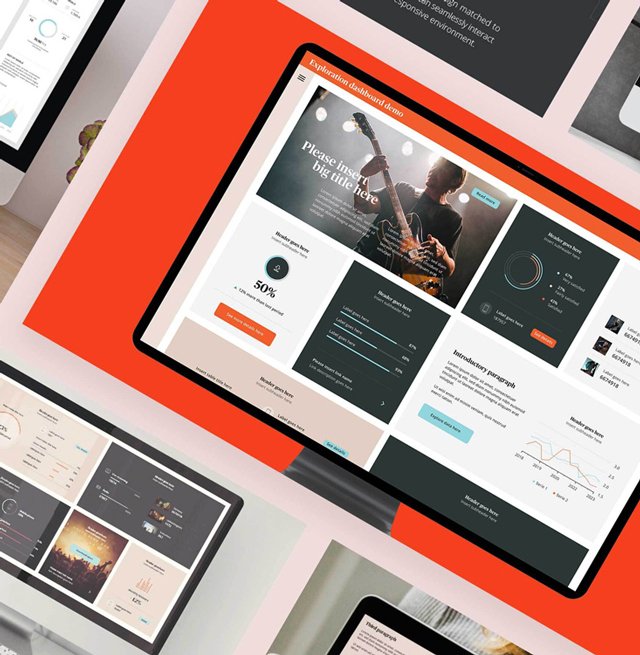
I joined Yonder to reimagine their dashboard solutions, turning complex datasets into intuitive and visually engaging tools. Each chart, graph, and visualisation was carefully designed to simplify information, highlight patterns, and help teams engage with data more confidently and effectively.